04 – CURRENT TEMPTATION, FUTURE FRUSTRATION

The fourth part of Series “Current temptation, future frustration“. This series is based on the companies which are currently darling of the market and many trying to catch such opportunities but it has a probability to become a reason for future frustration. It can wipe out the majority of gains in wealth. I am trying to put some of the number-crunching facts by which we can identify ongoing issues in the companies and can save our wealth.

I am starting this series with one of the company which is engaged in Entertainment / Electronic Media Software, has a 52 weeks low price of Rs.3.05 and LTP is Rs.9.20. This company has rewarded ~3.02x of return in a year.

Let’s start looking at the numbers.

We can see that the company has operating level profits but a loss at a net level. It can be possible if the business is at the nascent stage. But major expense is depreciation so have to check why huge depreciation charge.

When we look at the balance sheet then it seems that the company does not have any issue except debt. But when we look at the fixed assets then we get shocked. The depreciation rate is ~40% in FY19 and ~72% in FY20. I have not seen such a high-interest rate in other leading IT companies, there is max ~20% of depreciation rate in other IT companies.

When we move to the next, related parties then….

Then 72% of income in FY20 and 78% of income in FY19 comes from related parties. The company has 93% of receivables in FY20 of related parties.

This entire series is based on past available data and ignored the future development in companies and the stock market always looks at the future.

Disclosure – Companies mentioned in the article are just for an example & educational purpose. It is not a buy/sell/ hold recommendation.

This series contains learning from books –

Financial Shenanigans

Quality of Earnings

The Financial Numbers Game

Creative Cash Flow Reporting

02 – CURRENT TEMPTATION, FUTURE FRUSTRATION

The second part of Series “Current temptation, future frustration“. This series is based on the companies which are currently darling of the market and many trying to catch such opportunities but it has a probability to become a reason for future frustration. It can wipe out the majority of gains in wealth. I am trying to put some of the number-crunching facts by which we can identify ongoing issues in the companies and can save our wealth.

I am starting this series with one of the company which is engaged in manufacturers of Wind Turbine Generators (WTGs) in India, has a 52 weeks low price of Rs.16 and LTP is Rs.48.15. This company has rewarded ~3.01x of return in a year.

Let’s start looking at the numbers.

We can see that the company has a declining trend of revenue, operating & PAT level also incurring losses. But the company has delivered a good return in a year so it might be possible that the company has a strong balance sheet.

When we look at the balance sheet then I got shocked. The company has trade payable, inventories and receivables are higher than sales. Also, the company is getting higher advances from its customer which is again higher than sales so that the company should have a monopoly and everyone wants its products only. But then why revenue keeps on declining?

Cash conversion cycle of the company is of 497 days in FY20 means its take almost 1+ years to convert to cash. Even the company has receivables, inventories and payables as a % of sales are 174%, 131% and 139% respectively.

When I have looked at the related party transaction then Rs.450 cr of sales in FY20 and Rs.648 cr of sales in FY19 done through related parties which are 59% of sales in FY20 and 45% in FY19.

Another part, when we look at the advances from customers then all are from related parties only. This trick is used by the company to show slightly better CFO. Also, receivable from related parties is 20.49% of total receivables in FY20 and 18.40% in FY19. And if we look at the receivable as a % of sales to related parties then it is 60.16% in FY20 and 46.31% in FY19. Now, I am curious that related parties have ~Rs.1100 cr of the fund to give as an advance but do not have Rs.270 cr to pay for receivables.

When we look at the exposure of the company to related parties then it is worth of Rs.865.46 cr in FY20 and Rs.708.10 cr in FY19 which is 16.35% in FY20 and 14.94% in FY19 of total balance sheet size. These related parties are making losses.

The company has Cumulative CFO < Cumulative PAT which shows difficulties to convert PAT into Cash Profit. Also, CFO is artificially boosting through advances from customers which is from the related parties.

This entire series is based on past available data and ignored the future development in companies and the stock market always looks at the future.

Disclosure – Companies mentioned in the article are just for an example & educational purpose. It is not a buy/sell/ hold recommendation.

This series contains learning from books –

Financial Shenanigans

Quality of Earnings

The Financial Numbers Game

Creative Cash Flow Reporting

13 – ONCE A DARLING, NOW AN EVIL

The 13th part of Series “Once a darling, now an evil”. This series is based on the companies which were once upon a time darling of the market and now, it has wiped out the majority of all those gains. I am trying to put some of the number-crunching facts by which we have identified ongoing issues in the companies and have saved our wealth.

I am starting this part with one of the company is in the business of manufacturing and trading of iron and steel products which has an all-time high price of ~Rs.443 in 2012 and now last traded price at Rs.1.59.

Surana Ind01

In the first instance this company having a huge sales growth. But PAT has huge volatility.

So, we go deeper ….

Surana Ind02

Here, we can see that debtor day and inventory days are growing rapidly and assets utilization & return ratio are falling.

I would like to go further detail of it.

Surana Ind03

Here, we can see that CFO is very volatile with cumulative CFO of FY09-12 is Rs.-20 cr whereas cumulative PAT is Rs.88 cr so that CCFO<CPAT which indicates that the company has a working capital issue which we have seen in debtor days and inventory days also.

Surana Ind04

The company shows good depreciation cover because of the capitalization of assets. One can improve depreciation cover either through improving EBIDTA or by reducing depreciation. If an asset is capitalized then it is not expensed in the same year the asset is purchased. So that here the company has selected to reduce a depreciation.

Actual Journal entry of depreciation

Depreciation A/C Dr

            To Accumulated Depreciation or Fixed Assets A/C

Here, depreciation charge at income statement which will reduce the bottom-line of the company. And also added to the accumulated depreciation or directly reduces from the fixed assets so that value of fixed assets gets reduced.

But what happens when the company has decided to go for capitalization of depreciation

Fixed Assets A/C Dr

            To Cash A/C

Here, the value of fixed assets gets increased rather than getting it reduced and cash will directly getting reduce with that amount. The income statement does not have any impact it which resulted in reduces depreciation expenses and improves bottom-line.

So that when the company is making a capitalization of depreciation then we have to look at the FCF rather than just check CFO. And when we go for FCF then it’s negative in all the periods. Capitalizing an expenditure enhances current profitability and increases reported cash flow from operations. Capitalization of depreciation will increase the value of assets which is not a part of CFO but it’s a part of CFI so that FCF will provide us a better picture.

Also, the company does not have any interest cover.

Disclosure – Companies mentioned in the article are just for an example & educational purpose. It is not a buy/sell/ hold recommendation.

This series contains learning from books –

Financial Shenanigans

Quality of Earnings

The Financial Numbers Game

Creative Cash Flow Reporting

12 – ONCE A DARLING, NOW AN EVIL

The 12th part of Series “Once a darling, now an evil”. This series is based on the companies which were once upon a time darling of the market and now, it has wiped out the majority of all those gains. I am trying to put some of the number-crunching facts by which we have identified ongoing issues in the companies and have saved our wealth.

I am starting this part with one of the company is in the business of global education company, with presence across the US, 40 counties in the UK, Pan India, Singapore, 9 countries in MEA, Hong Kong and 2 countries in the Caribbean which has an all-time high price of ~Rs.437 in 2008, ~Rs.338 in 2012 and now last traded price at Rs.1.77.

CoreEdu01

In the first instance this company having huge sales & PAT growth. Also, the narrative of the business seems good. But such growth and good narrative should not be a reason for investment.

So, we go deeper ….

CoreEdu02

Here, we can see that debtor day and inventory days are growing rapidly with fall in payable days which has to turn out a cash conversion cycle to positive from negative & growing rapidly. Assets utilization & return ratio are falling.

I would like to go further detail of it.

CoreEdu03

Here, we can see that CFO is lower than PAT with cumulative CFO of FY07-12 is Rs.779 cr whereas cumulative PAT is Rs.982 cr so that CCFO<CPAT which indicates that company has a working capital issue which we have seen in debtor days and inventory days also.

CoreEdu04

If we here look at the depreciation cover then initially it was higher but that is due to lower depreciation rate. Later on, that depreciation rate has become almost double. This has an impact on CFO.

CoreEdu05

We can see that the borrowing part is growing in overall sources of funds and on the other side the highest part is other assets.

Let’s go deeper into it one by one.

CoreEdu06

Here, we can see that company has software development is in inventories but similar inventories are not available with Infosys and TCS annual reports, even not in their initial years’ reports. The company is capitalizing inventories as well as few other expenses on the name of inventories which has boosted profits but has affected balance sheet and cash flow statement.

Journal entry of Inventory

Cost of goods sold expenses Dr

            To Inventories

So when inventory gets sold costs are recognized into income statement but if you keep showing inventory not sold out then cost also gets understate which boosts profit artificially.

CoreEdu07

Here, we can see that company has intangible assets under development is Rs.529 cr in FY2012 and Rs.313 cr in FY11; Goodwill on Consolidation (arises due to investment in subsidiaries) Rs.118 cr in FY2012 and Rs.70 cr in FY11. These two items are 18% of the balance sheet. This is again a capitalization of expenses to balance sheet.

Journal entry of cost capitalization into assets

  • Assets Dr

                        To Cash

When we recognize assets created as expenses –

  • Expenses Dr

                       To Assets

So that cash keeps on reducing but borrowing keeps growing because there was just a capitalization of costs and not actual assets creation. This again boosts profits but when we look at the FCF then FCF always comes negative.

CoreEdu08

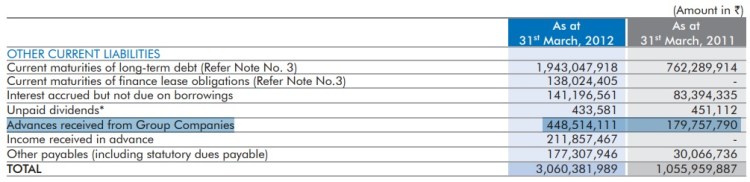
The company got an advance from group companies which increases the current liabilities part.

CoreEdu09

Here, the company has created provisions for fringe benefit taxes which a tax that an employer has to pay in lieu of the benefits that are given to his/her employees. A company has a pending to pay it means either company does not have enough money to pay it or they have created provision during the good time so that they can write back to boost profit.

Journal entries

When provision/liabilities get created

Profit & Loss A/C DR

           To Provision/liabilities A/C

When the provision was written back

Provision/liabilities A/C DR

            To Profit & Loss A/C

The company can boost profits whenever it requires to do.

CoreEdu10

The company has Rs.58 cr in the current account and Rs.37 cr of cheques on hand which is combined 60% of total cash and cash equivalents. Why does the company need to keep large funds into a current account where it does not get any interest?

In addition to all the above factors, the company has given a loan to related parties worth of Rs.116 cr in FY12, investment into subsidiaries worth of Rs.34 cr in FY12. We can see that company has put good efforts to hide many aspects but if we go into deeper, understand numbers, and read annual reports then it can visible to us.

Disclosure – Companies mentioned in the article are just for an example & educational purpose. It is not a buy/sell/ hold recommendation.

This series contains learning from books – Financial Shenanigans Quality of Earnings The Financial Numbers Game Creative Cash Flow Reporting