06 – ONCE A DARLING, NOW AN EVIL

The sixth part of Series “Once a darling, now an evil”. This series is based on the companies which were once upon a time darling of the market and now, it has wiped out the majority of all those gains. I am trying to put some of the number-crunching facts by which we have identified ongoing issues in the companies and have saved our wealth.

I am starting this part with one of shipbuilding and ship repair company which has an all-time high price of ~Rs.992 in 2008 and now last traded price at Rs.1.20.

ABGS 01

On the first instance this company having huge sales and profit growth. This creates a temptation to buy with missing out of the opportunity.

Also, when we look at the terms of trade (i.e. debtors to creditor ratio)

ABGS 02

Wonderful… should buy it immediately….

But when we go for deepen….

ABGS 02.1

Payable is growing rapidly and it was higher than total expenses. This creates a sense of cautions that which vendor allow to keep this long credit? Also, if the company is capable to pay then why the company is not paying dues?

ABGS 03

When we look at the Inventories, then inventory as a % of sales is higher than the sales. Means company has a good inventory pile up. Also, inventory days are above a year.

ABGS 04

Now, when we look at the common size balance sheet of the company than almost 89% of the balance sheet was in other assets in FY06. It makes me curious that whether it is a manufacturing company or an NBFC. If we go for a breakup of those other assets then the majority of the part was in inventories and remaining? The remaining part was in loans and advances. I don’t have an old annual report but when looking for the FY10 annual report then such things get cleared. That was almost 25% of balance sheet and ~40%+ of other assets in FY10.

ABGS 05ABGS 06

The company also has understated its depreciation. If we compare the depreciation rate with the peer companies then peer company has an almost double rate then the company.

ABGS 07

If we look at the taxation as per the Cash flow tax rate then it is substantially lower this creates a doubt that why to pay less tax than actual payment. There can be possible to have an artificially boosted profitability in the P&L account.

Disclosure – Companies mentioned in the article are just for an example & educational purpose. It is not a buy/sell/ hold recommendation. 

05 – ONCE A DARLING, NOW AN EVIL

The fifth part of Series “Once a darling, now an evil”. This series is based on the companies which were once upon a time darling of the market and now, it has wiped out the majority of all those gains. I am trying to put some of the number-crunching facts by which we have identified ongoing issues in the companies and have saved our wealth.

I am starting this part with one of the manufacturing, processing & trading of yarns, fabrics, ready-made garments and towels company which has an all-time high price of ~Rs.582 in 2008 and now last traded price at Rs.0.35.

SEL01

On the first instance this company having huge sales and profit growth. This creates the temptation to buy with missing out of the opportunity.

But when we go for deepen….

SEL02SEL04SEL03

Now, let’s look at the above data then though the company has good growth in sales and profit but not able to generate CFO. This will require to bring external funding in terms of equity and borrowing, and both have increased rapidly. Look at the receivable and inventory as a % of sales than 73%, 69%, 70% in FY08,09,10 respectively. Also, if we look at the debtor days and inventory days both are increasing rapidly.

SEL05

If we look at the taxation then as per the Cash flow tax rate then it is substantially lower this creates a doubt that why to pay less tax than actual payment.

Also, when we look at the investment than the majority of the investment made in subsidiaries.

Disclosure – Companies mentioned in the article are just for an example & educational purpose. It is not a buy/sell/ hold recommendation. 

04 – ONCE A DARLING, NOW AN EVIL

The fourth part of Series “Once a darling, now an evil”. This series is based on the companies which were once upon a time darling of the market and now, it has wiped out the majority of all those gains. I am trying to put some of the number-crunching facts by which we have identified ongoing issues in the companies and have saved our wealth.

I am starting this part with one of the network service company which has an all-time high price of ~Rs.3500 and now last traded price at Rs.1.25. and high of Rs.464 in the year 2010.

GTLL01

On the first instance, this company looks having not a huge problem except debt rising but for understanding it in a better way, we need to go deeper.

GTLL02

If we look at the tax paid in cash flow then that tax outflow is higher than what the company has posted in P&L statement. If we look at the actual PAT and reported PAT then both have a good diversion. This shows that the company has boosted PAT by ~40%+ on an average basis.

GTLL03

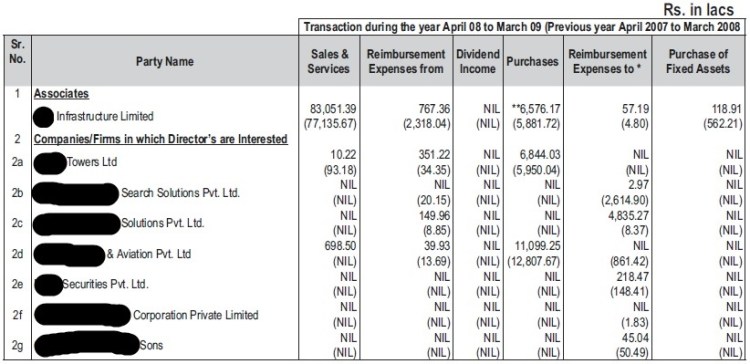
Now, if we look at the sales to the related party then that was ~44% and 43% in the FY08 & FY09 respectively. In FY09, ~44% payable was from the related party out of total payables. Company has made ~80%+ investment in its subsidiaries out of investment shown on the balance sheet. In addition, the company has 25+ subsidiaries and few were at Mauritius.

Also, during when the price was traded near too high in the year 2010, the promoter has started putting their stake in a pledge.

Disclosure – Companies mentioned in the article are just for an example & educational purpose. It is not a buy/sell/ hold recommendation. 

This series contains learning from books –Financial ShenanigansQuality of EarningsThe Financial Numbers GameCreative Cash Flow Reporting

Once a darling, now an evil

I am going to start this new series with all your love and wishes. Series “Once a darling, now an evil” is based on the companies which were once upon a time darling of the market and now, it has wiped out the majority of all those gains. I am trying to put some of the number-crunching facts by which we have identified ongoing issues in the companies and have saved our wealth. This series is an extension of my previous series Numbers tells you everything, this series I have left in midway due to some technical issues with my database.

I am starting this series with one of the graphic company which has an all-time high price of Rs.2100+ and now traded at Rs.0.25. and high of Rs.13.47 in the year 2007. Due to unavailability of data prior to 2006 and unavailability of the annual report prior to 2010. I have to start showing number analysis from 2006 only.

PEM 01

Wow!!! What a strong cash flow from operating activities!!! From the above data, the company seems strong but….

When we look at the balance sheet with putting P&L with it then….

PEM 02

The company need Rs.193 cr of fixed assets to do a sale of only Rs.97 cr. Sales are just a ~10% of the entire balance sheet size. Debtors of the company were Rs.221 cr and inventory worth of Rs.79 cr compared to the sales of Rs.97 cr in FY06. Debtors were almost 2.28x of sales and inventory was 81% of sales. Look at the below data.

PEM 03

Few more interesting data…

PEM 04

Means when a company sell its services, the company gets payment after 828 days in FY06 and 826 days in FY07. In addition, the company takes 295 days to convert its inventory into the finished products in FY06 and that increase rapidly as COVID-19 has grown.

Now, the question is if a company has higher debtors and inventories then how CFO remains much stronger.

PEM 05

The answer is here. Working capital changes have contributed that boost into the CFO. If we look component of it then debtors have majorly reduced but still in FY07, debtors as a % sales remain as high as earlier due to a sharp fall in the sales.

If we have look at these basic number analyses and not deep crunching then also, we have avoided investment into such company and have saved our wealth. I have not talked about the company’s investment worth of ~Rs.130 cr in its subsidiaries in FY10 and both the subsidiaries are located at Mauritius. Also, ~Rs.134 cr of advances recoverable in FY10. There are many such points but without looking at all such points, we have avoided and saved our wealth.

Disclosure – Companies mentioned in the article are just for an example & educational purpose. It is not a buy/sell/ hold recommendation.